
100 years ago, the list of America’s largest companies was topped by those in the steel industry, followed by those in oil and gas. 50 years later, steel companies were being replaced by those in oil-based plastics. As a result, oil and gas companies topped the list. Even as recently as 10 years ago, the top two companies on the FT Global 500 were oil and gas companies.
The last decade has seen a seismic, once-in-a-century, re-ordering in the commercial world. Today, data-gathering companies and data-gathering device-making companies are the most valuable companies, not just in the US, but in the world.
By proxy, we can ascertain that data, or to put it more crudely ‘consumer’s attention’ has risen to replace oil as the world’s most valuable commodity.
In this study, the Wolfgang 2020 KPI report, we have examined a third of a billion euros’ worth of data from the globe’s e-commerce activity. We’ve drilled into consumers’ research and purchase behaviour, and we’ve discovered a reservoir of valuable insights for marketers.
These insights enable marketers to benchmark their 2019 metrics, which enables them to assess and refine their 2020 plans.
Our planet is fast approaching ‘peak oil’. Will data continue to sit atop the commercial world for the next century? None of us will be around to find out, but as a digital marketer you are certainly well-positioned to enjoy a prosperous career for as long as you choose to wield your wits in this, the fastest moving and most fascinating of industries.
This study is our gift to you, the digital marketing community. It’s an annual labour of love for the crew in Wolfgang Digital. Deep-diving our industry always provides new and interesting learnings for us.
We hope the data we’ve mined and the insights we’ve extracted are highly valuable to you.

People are increasingly pressing ‘purchase’ on their mobile phones. Revenue on mobile devices has been the big mover again this year growing by 69%. Mobile now accounts for a whopping 54% of revenue and 70% of traffic. However, big ticket purchases are still more likely to take place on desktop. (% Desktop Revenue has a strong positive correlation (0.65) with Average Order Value).


People are increasingly pressing ‘purchase’ on their mobile phones. Revenue on mobile devices has been the big mover again this year growing by 69%. Mobile now accounts for a whopping 54% of revenue and 70% of traffic. However, big ticket purchases are still more likely to take place on desktop. (% Desktop Revenue has a strong positive correlation (0.65) with Average Order Value).
The propensity to purchase on a phone is highest for the online only retailer where mobile revenue is approaching mobile traffic levels. Multi-channel retailers of course will experience research online, purchase offline (ROPO) mobile behaviour which will create a gap between mobile traffic and mobile revenue as this user is intent on buying in store.
E.g. Google Search: “Buy jeans near me”

This is the first year that multi-channel retailers have had visibility on ‘research-online purchase-in-store’ data from Google Ads. By uploading Point Of Sale information to Google, retailers can now match in-store purchasers with online ad clickers, gaining further visibility on the success of their campaigns.
At Wolfgang, we’ve a close relationship with Google and we had the privilege of executing the first two ‘In-Store Sales’ campaigns in Europe. We are working with a very small dataset here, but we couldn't wait another year to share these remarkable findings with you.
| Metric | Additional Measured in "in store" transactions |
|---|---|
| Revenue | Additional 168% |
| Conversions | Additional 84% |
| AOV | 199% Higher |
You can see retailers are measuring an extra 168% in revenue in their in-store sales on top of what was made online.
What’s remarkable is the AOV trebles for in-store sales touched by online. This demonstrates that big ticket items which are typically expensive keywords with low online conversion rates such as “samsung smart TV” are actually highly valuable to the retailer who can measure the online advertising against an in-store sale.

Search (still predominantly Google) continues to make the World Wide Web go ‘round generating 65% of website traffic and a stonking 67% of website revenue on a last click basis.


Search (still predominantly Google) continues to make the World Wide Web go ‘round generating 65% of website traffic and a stonking 67% of website revenue on a last click basis.
The stand out stat here is that it’s the first time paid search has overtaken organic search to be the top revenue driver. We can expect paid search to consolidate its position here. In Google’s quest to scale revenues in a maturing search market, one of their key strategies is to transform high-converting organic traffic into high-converting paid search traffic.
According to Google Analytics, social media now accounts for 8% of website traffic. This is a 60% increase from last year, while share of revenue has jumped to 4% - a 100% increase.
Social is the fastest growing driver of e-commerce sales. As shoppable ad formats become more popular (e.g. dynamic product ads) brands are starting to see increased ROI from Social and are investing more in these channels. Our correlation calculation found those websites who were generating more social transactions than their peers were among the highest performing websites overall in the study.
| Organic | Paid Search | Direct | Social | Display | Referral | Other |
|---|


The question “Is SEO Dead?” is actually older than Google can you believe? The death of the search engine was first prophesied in 1997!
Every year, alarmist digital marketers attract anxious clickers with statements concerning the impending death of SEO. This year, we have seen paid search overtake organic for driving revenue and we’ve seen Google continue to scrape publishers’ websites and cannibalise their traffic. So, has it finally happened...is SEO on its way to the knackers’ yard?
The best way to find out is to look at year-on-year organic traffic and organic revenue figures for our e-commerce data set.
As you can see, organic revenue is showing healthy double-digit growth across all sectors. A stark illustration that SEO remains very much alive and kicking.
It’s notable that Travel sector revenue is growing slower than Retail revenue. In Google’s continual quest to scale revenues, one of their tactics is to transfer converting organic traffic to converting paid traffic. A number of new SERP features such as hotel local packs and new ad formats such as hotel price ads introduced over the past year do exactly this.


In 2016, Comscore forecast that by 2020, ‘half of all searches would be voice’ (which, it transpires, is a dubious misquote). This stat jilted the search community into a vociferous debate.
Currently, there is no definitive way to see voice search performance data in Google Analytics or Google Search Console. The only path we have to analysing voice searches is via a Wolfgang reporting favourite; the Google Ads search query report.
“OK Google I’ve scored I need a hotel room near me tonight!” - Actual search term for a hotel client 😊
We’ve analysed search terms for 30 million Google searches that triggered ads. We mined the data for voice identifiers “OK Google” and “Hey Google” to get a sense of what portion of searches started with a voice search command.
Based on this methodology we found an infinitesimal portion of search queries started with a voice identifier.
0.05% to be precise.
There are limitations to this methodology. For example, voice searchers may hold the button rather than commence the voice search with a voice command.
An interesting feature of this methodology is that it is specific to searches that trigger an ad, which are those with commercial intent. Therefore, it doesn’t account for the majority of searches which are informational rather than commercial.
For example - “What’s the weather like in Madrid today?” isn’t captured, but “OK Google, what’s the best 4-star hotel in Madrid” is. But high commercial intent search queries like that simply aren’t happening in any meaningful way.
Based on this imperfect data, we can infer that marketers don’t need to rush into developing a voice search strategy to recapture the 50% of their traffic they are about to lose in 2020 according to Comscore.
The logic behind the forecast that voice searches will rise is very simple. Talking is faster and easier than typing.
But what’s faster and easier than talking?
Thinking!
Zuckerberg and Sanderberg are currently funding research on brain-machine interfaces that can pick up thoughts from your neurons and transform them into words.
Can you imagine the ads that would disturb your newsfeed scroll if Facebook could read your thoughts?
Disturbing indeed.
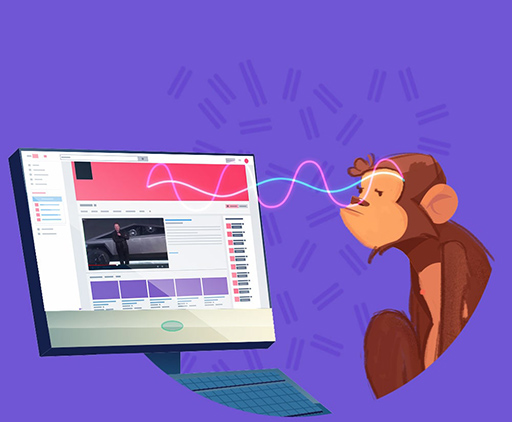
Thought as an interface sounds far-fetched, but in 2019 Elon Musk announced his cyborg company, Neuralink, has already allowed a monkey to control a computer with it’s thoughts!
If Artificial Intelligence and the monkeys strike a pact, we could all be in trouble.


The Average Page Load Time is getting faster at 5.1 seconds, down from 6.8 seconds last year.
Although it’s still a long way off Google’s recommended target of 2 seconds, this is a move in the right direction. Our data revealed that websites that had the highest average page load time had the lowest number of sessions per user and session length over the last 12 months. Meaning people won’t hang around. The higher your website load time is, the less time people spend on your site. Keep working on making those websites faster!
Perhaps the most under-analysed, yet most important metric is Avg. Sessions per User. If you are comfortable diving deep into Google Analytics and getting mucky creating segments, then Avg. Sessions per Purchaser will be an eye-opening metric for you.
Our data shows that the average online purchaser requires about 2.5 times as many clicks as the average visitor before making a purchase. It’s clear there is more value in creating extra visits from existing users than a first click with a new user. The best performing websites are the ones that can attract that user back again and again, increasing their Average Sessions per User.
Insights around your customer’s path to purchase are the most important insights you can uncover. Our correlation calc validates this with higher Average Sessions per User a key differentiator of the high-performance websites.
These insights dictate that the key role of a digital marketer is to create elegant customer interactions that guide people on a journey from prospects into purchasers. Anything you can do to increase your Average Sessions per User is the most impactful marketing you can do.
In Wolfgang we suspect the most valuable untapped opportunity to garner extra relevant clicks from your website traffic is in all those upper funnel Google Ads keywords that have great CTRs but poor conversion rates.
The current thinking for conversion focused search marketers is “if it ain't converting whip it out of my campaign!” But if a marketer accepts the purpose of these keywords isn't conversion but just to bring in top of funnel traffic, they have identified an uncompetitive space to hoover up relevant clicks.
The top of funnel clicks that prove most fruitful can then direct future SEO and Content activity.

Overall Conversion Rate is coming in at 1.84%. Average Order Value is coming in at €185. We’ve also included Conversion Rate by User which is coming in at 3.2%.
| Conversion Rates | Conversion Rate Per User | Average Order Value | |
|---|---|---|---|
| Retail | 1.9% | 3.6% | €101.95 |
| Multi-Channel | 1.8% | 3.1% | €99.25 |
| Online Only | 2.3% | 4.6% | €107.03 |
| Travel | 1.6% | 2.3% | €355.05 |
| Travel - Hotels | 0.9% | 1.2% | €453.04 |
| Travel - Tickets & Tours | 2.6% | 3.8% | €201.08 |
| Overall | 1.8% | 3.2% | €184.79 |


An interesting view on the findings is to compare them with the same results from 5 years ago, our 2016 KPI Report.
The “What the top performing websites do differently” section in 2016 provided accurate predictions of what trends would emerge over the next 5 years. The two strongest conversion rate correlations we found in 2016 were:
Two of the stand out findings in the 2020 report are:
So we can see the top performing tactics of the top performers were cottoned onto and replicated by the chasing pack 5 years later. Of course the top performers are already out ahead with new points of differentiation.

We are privileged to count a number of particularly high-performance websites among our dataset participants. There have been over 20 international digital marketing awards won by a spread of participant websites in the last 3 years.
Perhaps the most unique part of this study is the correlation calculation which determines what the best performing websites do differently.
We analyse the best performances in Conversion Rate, Conversion Rate by User, Average Order Value, Revenue per Session, total Revenue and year on year Revenue growth against all other website metrics to identify correlations and this year we have found some stonkers.
The websites that had significantly higher levels of the above were the high-performers when it came to those all-important conversion and revenue success metrics.
A correlation shows the strength of a relationship between two metrics. They are measured on a scale from 0 to 1, where 0 means no correlation or relationship between the two metrics and 1 means a perfect correlation between the two metrics. A negative correlation indicates an inverse relationship between the two metrics, so as one decreases the other increases.
Correlations are not an absolute guide. ‘Correlation is not causation’ is an important limitation to note. Another limitation of correlations is they don’t throw up the smart things everybody is doing, just the differentiators between the high performers and the pack. For example, just because referral traffic correlates strongly with success and search traffic doesn’t, that doesn’t mean you should divest search for referral. Search is still your most important traffic source, it’s just that the proportion of traffic from search is no longer a differentiator.
However, correlations are very effective as a general guide to kick start investigations and consider new approaches.
Here’s our countdown from 4 to 1 of the strongest points of differentiation between the top performing websites and the chasing pack:
The 2010s were a race to the bottom of the purchase funnel. Brands poured budget into Search, then into retargeting to inch their advertising closer and closer to that precious moment of purchase. Now that Search is saturated with competition, marketers are attempting to beat their competitors to the click at the point of search by beating them to the person in their pre-search behaviour. In effect, marketers are racing back up the purchase funnel. We saw strong correlations (0.34) with Average Order Value from websites that got higher than average referral traffic (not Search, not Social, but other websites!) and I can’t believe I’m going to write this, but Display traffic (0.37), correlated with Average Order Value. In my 12 years as a digital marketer that's the first time I've seen big data advocating for display for conversion.
Every budding business student knows that when volume increases, cost per unit decreases and it’s called economies of scale. But what do you call it when it’s revenue per unit that’s increasing with volume? At Wolfgang we call it efficiencies of scale. Similar to last year’s report, one of the strongest correlations against a number of the success metrics was simply the number of sessions. More visitors to the site equals a higher Conversion Rate per User, 0.7. This stat summons the final wag for the long-tail of smaller specialist retailers. This finding is consistent across both the Retail and Travel sectors.
Similar to last year’s report, another of the strongest and most consistent correlations was the number of Sessions per User, 0.7. The average online purchaser visits a website 5 times before parting with their cash, clicking about 2.5 times more than the average website visitor. This tells us that there is more value in creating extra visits from existing users than a first click with a new user. The best performing websites are the ones that can attract that user back again and again. So how should you go about creating those extra interactions...
The three strongest conversion correlations across the 4,000 datapoints were related to social transactions. This tells us that the tip-top performing websites were significantly better than everybody else at generating social traffic which went on to buy. Google Analytics is astonishingly rigorous at suppressing social media success stats. It appears they would rather an inferior analytics product than to accurately track cross-device conversions and give Social its due. They can track cross-device conversions in Google Ads, why not in Analytics? So, if our Google Analytics pulled data is telling us Social is the strongest conversion success factor, we need to sit up and take notice. While a third of marketers admit they still don't know what to do with social media, our data tells us the top performers have a robust social strategy and it’s actually the strongest point of differentiation between them and the chasing pack.
We can expect these points of differentiation to become the biggest trends in digital marketing over the coming years.
The strongest correlations are listed here.

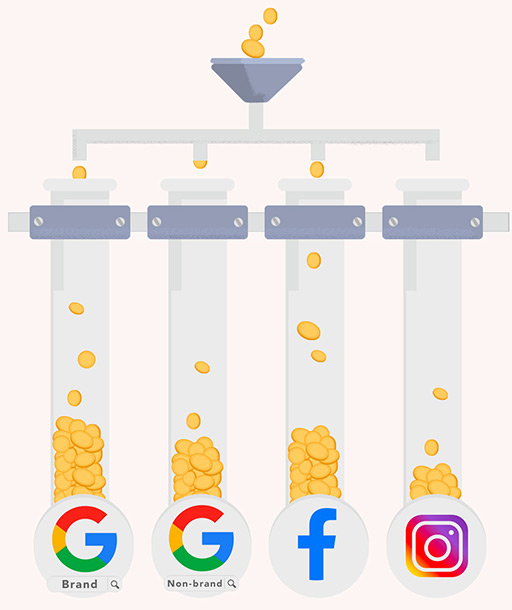
Make sure you get more bang for your buck by investing in the right channels. Unsurprisingly, Branded search brings in the highest Revenue with a ROAS of 47.0… More on this later.
Overall, advertisers can expect a 10:1 ROAS from Google Search which shrinks to 2.3 when you remove brand.
On social it's still all about the Facebook feed for delivering ROAS with feed actually driving a higher ROAS than Google Shopping!
Messenger and Marketplace are not far behind Feed so these placements should be considered a vital component in your bottom of funnel strategy. Back in 2017 marketers were nervous when Facebook warned that ad space in the Feed was running out. We can all breathe a sigh of relief now that Feed is still driving results and that other placements are not far behind in driving ROAS.
Instagram is still struggling to compete with Facebook for ROAS, we’ll dive more into that later!
*Google Analytics default attribution model assigns 100% credit to the last click touchpoint (no cross-device tracking).
*Facebook attribution model is 1-day post click, we are telling Facebook to only claim a purchase if someone has clicked on our ad and purchased within 1 day.


This is an emotionally charged topic for a lot of marketers. An often-asked question is “Should I bid on my brand or not?”.
Users like to visit a website multiple times before making a purchase, the buying click is typically a branded click.
Should an advertiser pay for ad clicks for searches on their brand, when they are already showing on top of the organic list below? By failing to advertise on their brand an advertiser might lose that buying click to a competitor advertising on their brand.
In Wolfgang, we advise advertisers to bid on their brand. Brand clicks tend to be not only the cheapest clicks you can buy, they are the best converting clicks too. This is borne out in the industry averages below.
There’s nothing as enraging for a brand owner than a competitor advertising on their brand attempting to steal their customers. Truth be told, Wolfgang Digital found ourselves in a spot of bother with the authorities a few years ago when we got into a “digital marketing dance-off” with a competitor, scarlet!
Scarlet: /’ska:lit/ adjective Irish slang for "I feel embarrassed"

Facebook’s global brand value has fallen for the second year in a row. Among the FAANG group of technology companies, Facebook is the only one to decline since Apple's drop of $0.1bn in 2002 which is likely a reflection of the social platform's famous privacy breach in 2018. So, Facebook is in decline right? Not according to our data.
Facebook is still the leader when it comes to social media traffic, conversion and ROAS. We analysed the % of sales per placement and a whopper 93% of sales are coming from ads on the Facebook news Feed. 88% of clicks are also coming from the Facebook Feed. This is where we recommend you spend your bottom of funnel spondulas.


According to our survey, Instagram is the most loved channel, especially amongst the under 40s. It may be the favourite channel for thumb aching scrolling, but it’s yet to compete with Facebook for ROAS. Despite Instagram’s attempts to turn it into a shopping platform (introducing shopping tags and DPAs) users are still only window shopping on Insta and purchasing from Facebook.
A hefty 76% of survey respondents said they have never bought anything from Instagram’s shopping tags and we know that only 3% of sales are coming from Instagram directly.
However, 75% of people surveyed said they purchased a product they saw on Instagram at a later date through a different channel. Instagram is driving product consideration, while Facebook and Search are driving sales.


86% of survey respondents said they would be more likely to make a purchase based on seeing a friend or family interact with a brand on social. These responses are an overwhelming illustration of Social’s continued advocacy advantage. Newly released ad formats from Facebook and Instagram such as Branded Content Ads and the Collaborations tool, have made it easier than ever for brands to enable, enhance and measure their customer’s content.


The frenetic pace of innovation belies a tech adoption wheel that turns slowly. Consumer adoption and commercialisation can take decades. The 2010s mark the completion of a number of important cycles, varying from centuries to decades.
1. 2010s were a once in a century decade which re-ordered the commercial world. 2 billion people migrated chunks of their lives to a virtual world. This led to data overtaking oil as the world’s most valuable commodity. Data is a big and broad word, we are specifically talking about people’s attention in the virtual world. Apple makes the devices which literally teleport our attention from the natural world to the virtual dimension. Google and Facebook are the largest marketplaces for our attention, and our intention, in this virtual world.
In this new space we aren’t human, we are data. We do express our humanity there, but we express it through data. And the internet giants have been monetising this data, monetising us, to build their fortune.
2. A twenty year cycle reached an important benchmark too. Paid search topped the charts of revenue sources capturing 34% of website revenue. Arriving almost exactly two decades after the launch of Google Ads. This is by no means the death of SEO which is a mere percentile behind it, 33% of website revenue, and still offering double digit year on year revenue growth (21%).
3. A decade-long cycle is the focus in the funnel. For the majority of the 2010s marketers were racing to the bottom of the purchase funnel. More and more budget flowed to Search to win exposure to the searcher - that person pounding on their keyboard with their credit card between their teeth, drunk on the newfound novelty of online shopping. The only advertising that performed better than Search was remarketing, which inched the advertising closer and closer to that precious purchase moment. Now in 2020, these essential elements of the marketing mix are operating at their maximum for any advertiser worth their salt. Top performing websites are focusing extra budget back up towards the top of the funnel. The best way to kill the competition on Search is to have the audience’s first search, be your brand. Outmarket your competition by generating more of your cheapest and best converting traffic.
4. The 2010s were the decade of the smartphone. 3G launched in 2008, the iPhone in 2009 and here we are 10 years later there are 3 billion smartphone users on planet earth. There are 2.2 billion Christians gazing up to their God. There are 3 billion smartphone users gazing down at their screens. Christianity got there after 2 millenia, smartphones in a decade. Astonishing. Our data shows 70% of traffic is now teleported to websites via smartphone. The majority of online revenue, 54%, is now from these hand-held shopping centres.
5. A third decade-long cycle relates to small and nimble v large companies. The long-tail of retailers were the early settlers in the e-commerce land of plenty. Very specialist websites with a narrow product range could capture high volumes of traffic and sales.
E.g. www.outboardengines.com could dominate the SERP and then affiliate link or dropship product, making for a highly profitable small business. The entrepreneur behind this microbusiness could automate the process and replicate the model again and again for the products of her choosing. Timothy Ferris’ book, The 4 Hour Work Week became the bible to the first flush of digital nomads and affiliate conferences in Vegas saw leaning towers of chips being pushed around with wild abandon by solopreneur digital marketers..
Alas, by the end of the decade, Google had started to prioritise brands in the SERP, and the big boys had finally gotten their online act together. As a result, we are now seeing significant 'efficiencies of scale'. This means the conversion rate per user of a larger website in terms of traffic, dwarfs that of a smaller website. Anything an e-commerce merchant can do to increase relevant traffic will in turn increase their conversion rate per user.
6. What’s the key insight digital marketers need to act upon to succeed in the 2020s? Average sessions per visitor is 2, average sessions per purchaser is 5. The role of the marketer is to create an elegant journey across touchpoints to deliver a person from prospect to purchaser. Any activity which increases sessions per visitor will increase conversion. As per the previous takeaway, top performing websites are starting the journey high in the funnel. Our top tip is to target relevant but not converting top of funnel searches with brand budget to win the purchase at a later date.
2020 marks the beginning of the end of this version of the web, the 3G & 4G smartphone powered internet. It’s been a wild ride. What will the 5G & 6G smart device internet bring? What cycles are just starting? At this stage we’re guessing. We can talk about voice, machine learning, the IOT, the selfie generation will become the quantified self generation, Augmented Reality will increase the intersection between our natural world and the virtual world, smart kitchens will mean us marketers have to learn how to advertise to a self ordering fridge, steaming hot coffees will be delivered to us in minutes by drone and we’ll be ably assisted by Elon's army of AI-powered cyborg monkey assistants. Who knows? What we do know for certain is that the most successful marketers, as always, will be the ones who can extract and act upon customer insights.
Data after all, is the new oil.

Wolfgang Digital, “The Digital Marketing Scientists” are a gang of digital marketing nerds who are particularly passionate about performance. Our mission is simple; exceptional digital marketing. We’re very proud holders of two Google Premier Partner Awards, the “Best Large Integrated Agency” with the European Search Awards 2019 & 2018 and the “Grand Prix” prize with the Global Landy Awards 2018.
We analysed over 130 million website sessions and over €330 million in online revenue over the 12 months from November 2018 to October 2019 and surveyed over 300 people across Europe, the UK and the US to compile this report.
Sign up for our monthly newsletter to read our monthly updates on the Battle of the Internet Giants and more. Subscribe to our YouTube Channel to watch weekly Wolfgang Bites; our 4 minute videos on all the latest digital marketing ‘must-knows’.
We offer digital marketing, consultancy and training services to companies all over the world. Email [email protected] today to start improving your online performance.
Words by Al | Designed by Jen | Developed by Fionn | Data by Ciara, David & Roisín