KPI Study 2016
What's it all about?
Here at Wolfgang Digital we’ve always found it tricky to source reliable e-commerce KPI benchmark data, particularly specific industry level KPI benchmarks. We want to know what makes a good website tick. To do that, we want to collate data, lots and lots of data.
We ran a similar study back in 2014 which you can see here. This time we want to go bigger and that’s where you come in.
Want To Get Involved?
We’d love contributions from people all over the world, it’s really rather simple, just send us a dashboard from your Google Analytics account, and a few exports of other reports (full details below).
What’s In It For Me?
- The warm fuzzy feeling from contributing
- Access to deeper contributor only results. This is where we get into the exclusive nitty gritty details. This information will allow you to benchmark yourself against the industry across multiple facets of your website, from ‘devices’ to ‘channels’ to ‘site speed’
- There'll be a link in it for you from the Wolfgang Website!
What Do I Need To Do?
Well first off there are a few caveats, in order to participate you’ll need to fulfil the following criteria:
- Be an e-commerce website with Google Analytics E-Commerce set up and functioning for the 12 months between April 1st 2015 and March 31st 2016
- Have turned over at least $60,000 (or local currency equivalent)
- Be in the retail or travel vertical
With the formalities out of the way we need for you to send us a few reports from Google Analytics:
1. Ecommerce Dashboard:
- Click on the following link, this will create a dashboard in your Google Analytics profile
https://analytics.google.com/analytics/web/template?uid=gzAotaGHQMCWGwuSKEI9mg - Set the timeframe to ‘April 1st 2015 and March 31st 2016’
- Export the dashboard as a PDF
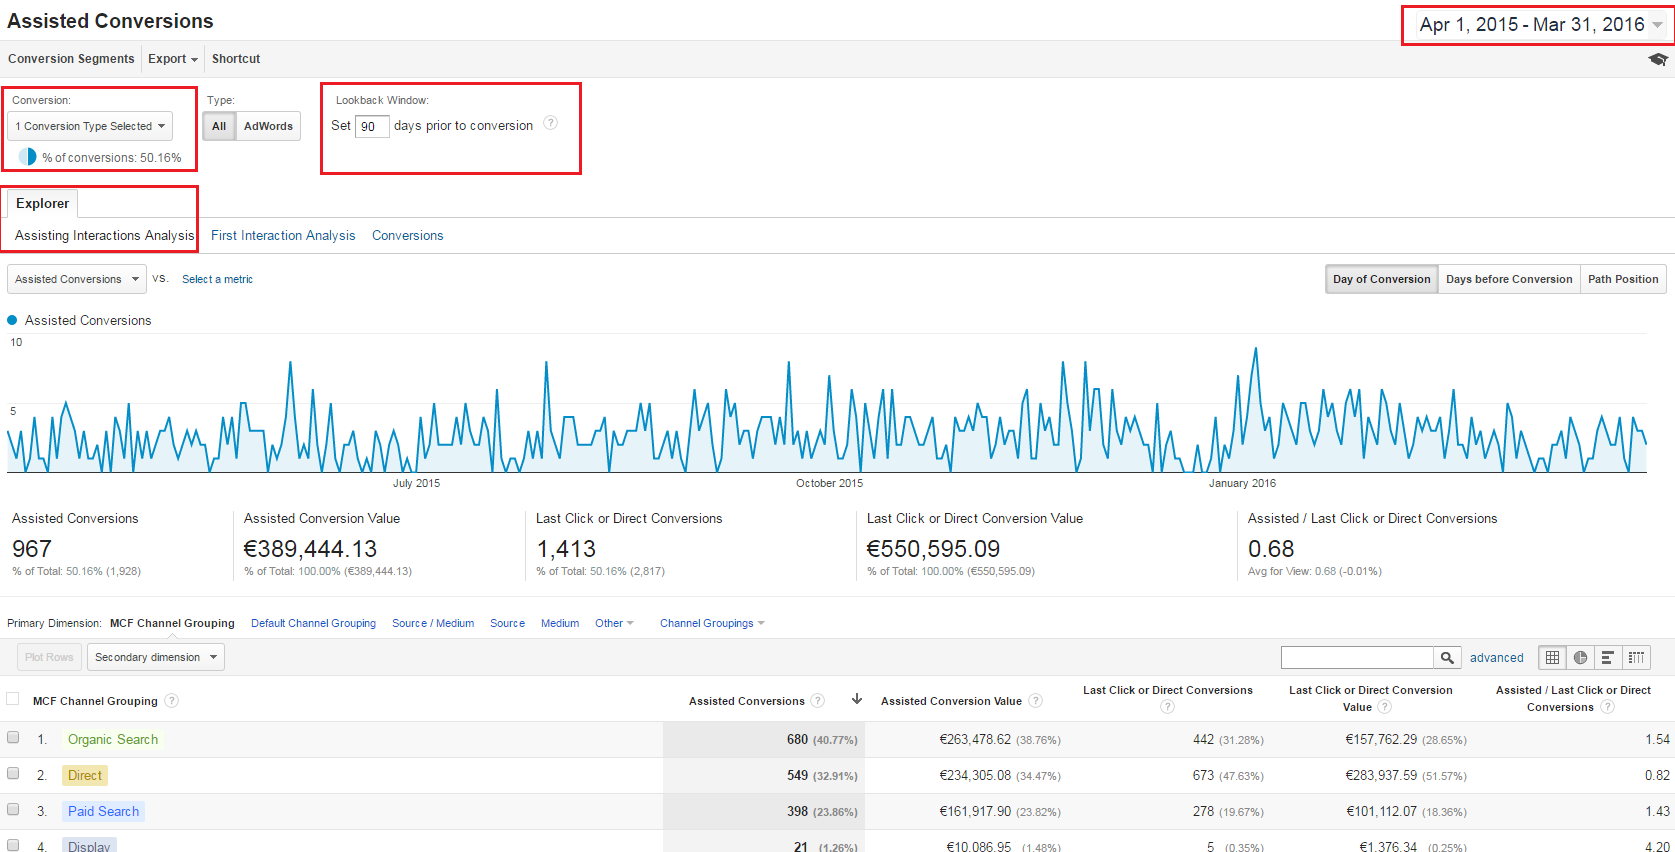
2. Assisted Conversion Report:
- In Google Analytics, navigate to Conversions -> Multi-Channel Funnels -> Assisted Conversions.
- Ensure conversion type is set to ‘Ecommerce’ only
- Set the lookback window to 90 Days
- Set the timeframe to ‘April 1st 2015 and March 31st 2016’
- Ensure ‘Assisting Interactions Analysis’ is selected
- Be sure to use the default MCF Channel Grouping
- Export as PDF
- See example below:
3. Time Lag Report:
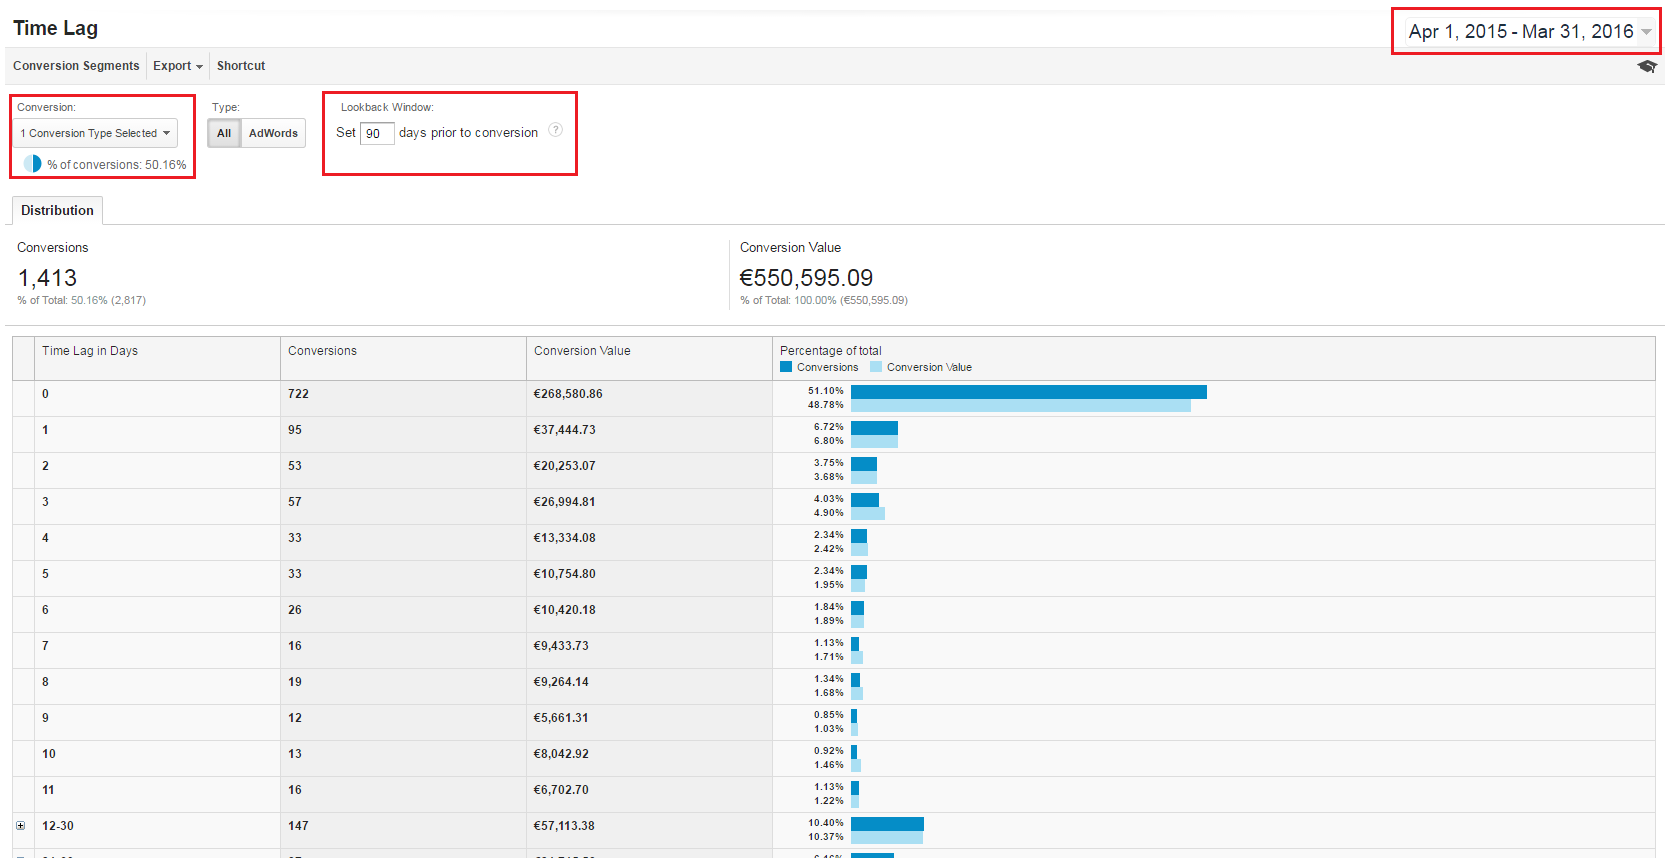
- In Google Analytics, navigate to Conversions -> Multi-Channel Funnels -> Time Lag
- Ensure conversion type is set to ‘Ecommerce’ only
- Set the lookback window to 90 Days
- Set the timeframe to ‘April 1st 2015 and March 31st 2016’
- Export as PDF
- See example below:
4. Path Length Report:
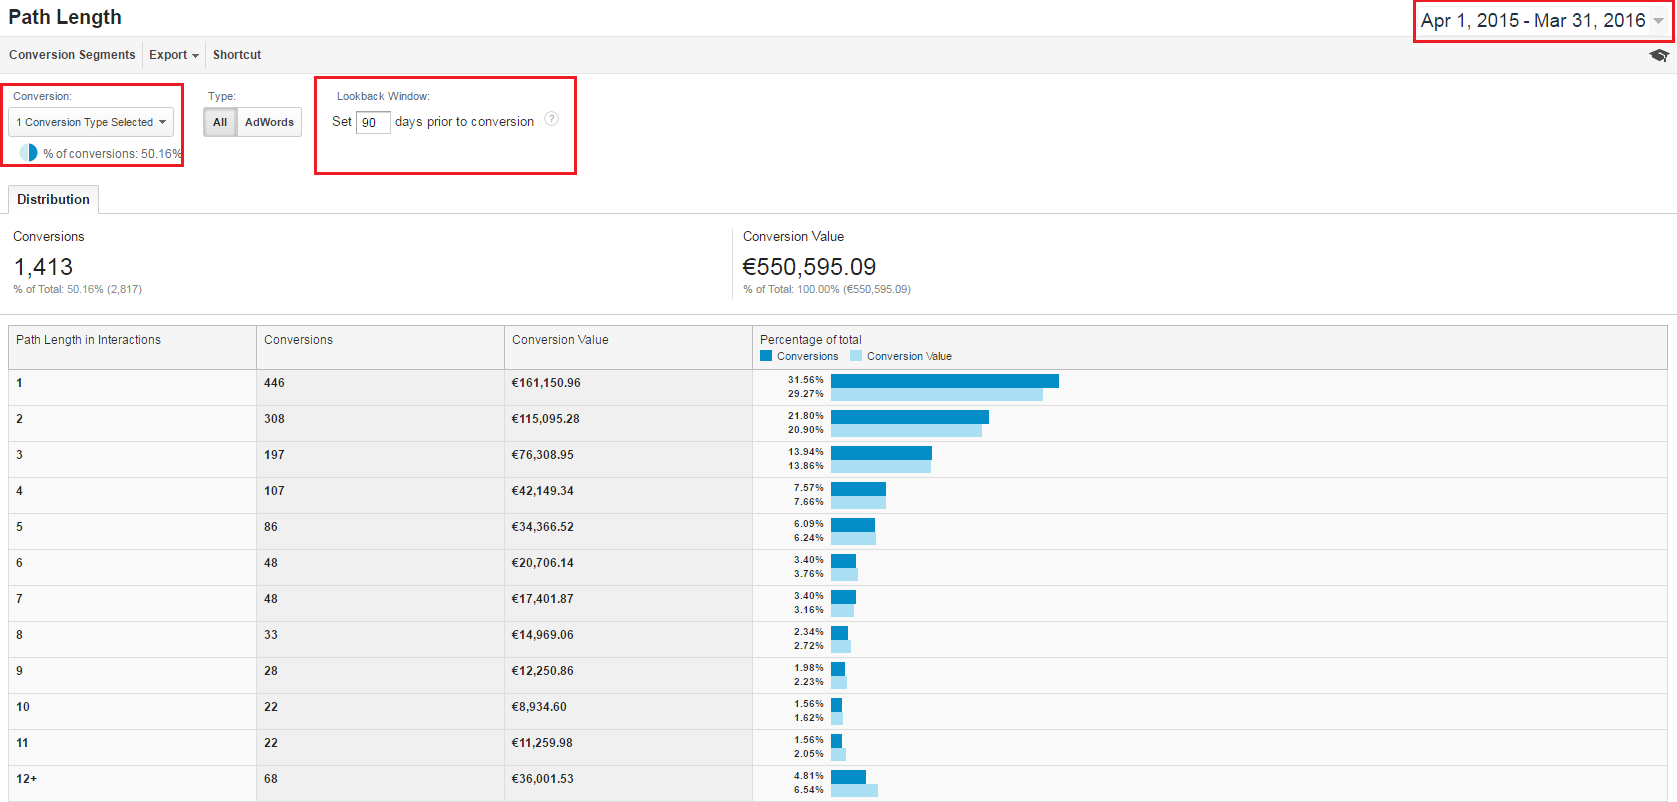
- In Google Analytics, navigate to Conversions -> Multi-Channel Funnels -> Path Length
- Ensure conversion type is set to ‘Ecommerce’ only
- Set the lookback window to 90 Days
- Set the timeframe to ‘April 1st 2015 and March 31st 2016’
- Export as PDF
- See example below:
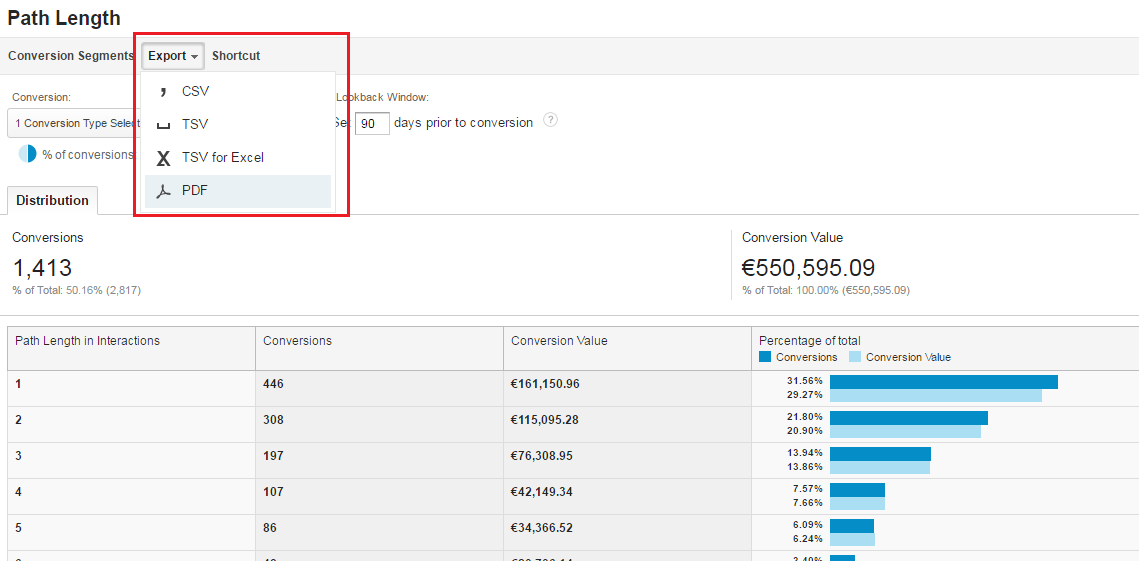
To export a PDF:
In order to export as a PDF just hit this button at the top of the various report pages:
What Next?
Email the four reports to [email protected] with the subject ‘KPI2016’ and we’ll take it from there.
Be sure to mention in the email whether you are in retail or travel. If you’re in retail please mention whether you are online only or if you have a physical retail store too. If you’re in travel we need to know if your business is based on package purchases or single purchases (e.g. flight, hotel, tour) as we will be breaking out results for these sub verticals.
It goes without saying that any information that you send us will be held in the strictest confidence. All data is confidential. We will publish contributor names (with a link) but no data associated with any contributor will be published.

.png)
.png)





_2025.png)
