By Gus Pelogia on 29 Aug 2018
.jpg)
It’s no secret that SEOs and PPCers don’t get always get along well. Who delivers the best ROI? Which one can prove to be the best investment? Here at Wolfgang Digital, we believe a good strategy needs both channels holding hands and working aligned to deliver the best results, so we always look at both together as much as possible to drive strong results to our clients.
In order to don’t let a juicy conversion slip through our hands when the information was just there waiting for us to act upon, we prepared 7 ways to integrate your data to power up what you have in hands to show extra insights behind both channels.
Note: If you watched my talk at Give it a Go in Leeds, you know the 7 points below and can go straight to the template at the of this post. If not, your reading continues right below. Although we're talking about SEO and PPC here, there are tons of other marketing channels to explore out there!
What will you need?
To find the answers below, you will need a few tools. The good news is: you probably already have most of them! Obviously, you need to start with Google Search Console (GSC) and Google Ads (any PPC data comes from there). Then, a crawler (Screaming Frog, Sitebulb, etc) and a keyword tracker (if you need a free one to start, go to RankTank).
Don’t forget to define the period you’d like to report on and make sure to select the same dates both in GSC and Google Ads, or you will have to start all over again!
Finally, all the data will sit on a Google Sheet or Excel, as you prefer!
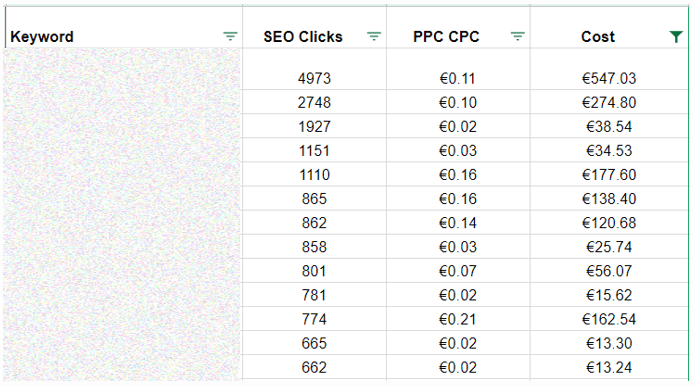
1 - SEO traffic cost (if you had to pay for it)
Google Ads provide their customers with a lot of numbers and data “ready to go” that SEOs would love to have. It’s relatively easy to prove the value behind PPC, at least when it comes to a simple math like “you spent this and earn that” and “this keyword costs X and returns Y”.
However, SEOs won’t have this number straight away tight to specific keywords. But at least you can say how much that traffic would have cost (if your client had to pay for it). The multiplication math is simple: GSC Keyword * CPC Google Ads.
Here’s a visual example of how this looks like:
2 - Your brand coverage
If someone is searching for a specific brand on Google, it just seems obvious what they’re looking for, right? Yes, however, PPC made simple for someone to take that traffic from you. Not to blame Google, as someone looking for a brand is often looking for a product or service and might find a better deal somewhere else. The price for a competitor bid in your brand is much higher for them, but they’ll still take the shot and take a few clients from you.
How do you know how well you’re doing? Pick your keywords from GSC and match the PPC and SEO click-through rate. Most keywords will match and you’ll be able to roughly know what is the percentage of branded traffic is being taken from you.
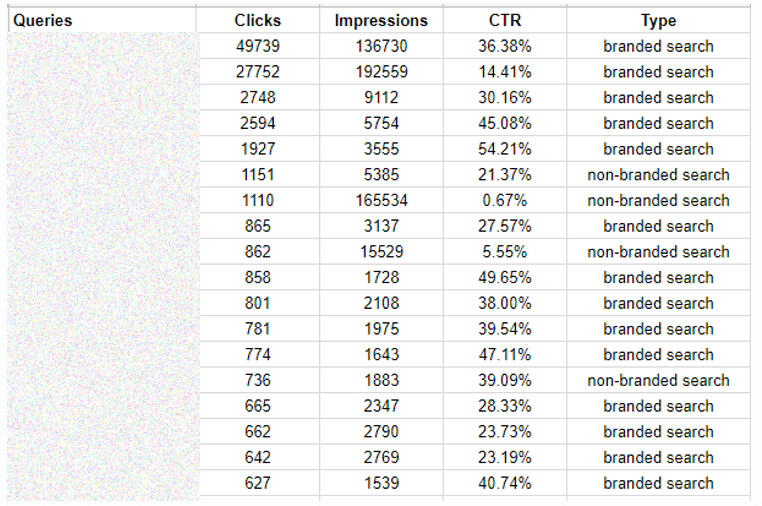
3 - Branded vs Non-Branded traffic
The goal here is to uncover what percentage of your traffic is branded vs non-branded. If you already did a keyword research and know roughly what is the total search volume for your brand and products, this should give you an idea what is the size of the pie you’re taking now. Of course, this doesn’t mean the same as sales, but you can go further merging with your conversions data.
This answer comes in two steps. First, use a little formula on Google Sheets to find the keyword type. Having your list of keywords ready from Google Search Console, just change the “”*brand-name*” field by your company’s name.
=ARRAYFORMULA(IF(A2:A="","",IF(ISNUMBER(SEARCH("*brand-name*",A2:A)),"branded search","non-branded search")))
Great! Now you already classified all if your keywords and this took you only a couple of minutes. The second part is to sum all of the data and find your percentages in a graph like this one:
Other questions might pop from this data: is your brand growing? What is the size of the pie you’re taking? Is your non-branded traffic compatible with your goals? This answer is not final but this is more of an insight and a good moment to start more conversations about your brand and KPIs.
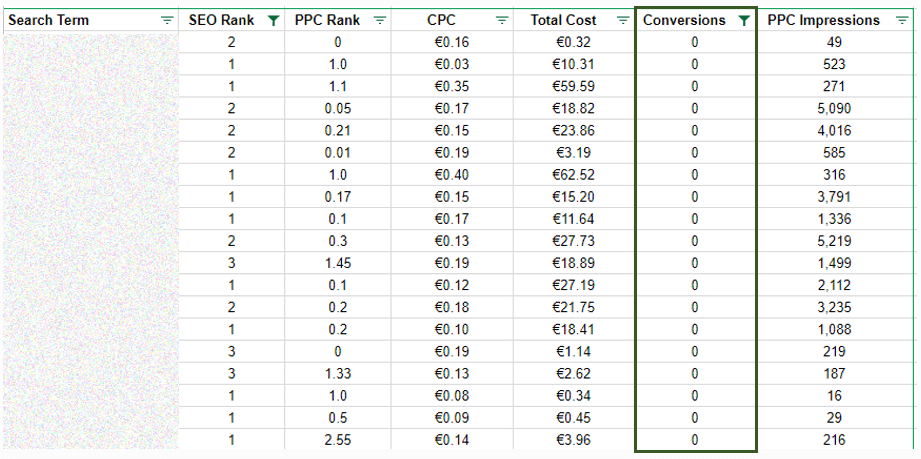
4 - Weak SEO coverage, high PPC conversions
We always look first at search volume to decide which keywords are most important. That makes sense, right? But at the end of the day, your client is only really happy if you can convert this into sales. So why not look at conversions to know which are your hottest keywords? Now, one step more: where is your SEO is missing in terms of conversions?
You can filter the data as you prefer here: let's say all keywords that rank on page 2 for SEO but deliver PPC conversions. This is an easy way to find out where your weak SEO coverage is affecting the end of the funnel.
This is the first learnings from this post that will require data from a keyword tracker. Many SEO tools provide this service (Moz, SEMRush, SEO Monitor to mention a few) but if you want to start for free, now, take a look at Rank Tank.
5 - The money wasters
Hopefully, by this point, you’re leaning towards a friendship between SEO and PPC, or at least see some value in the data from the other side. I’m an SEO, but I imagine that managing a budget is probably one of the biggest challenges in PPC.
If you’re on a budget, here’s a place where you can save: check your low converting keywords with high organic rankings. Filter down your top 3 SEO rankings and your keywords with low or no PPC conversions.
6 - Compare your landing pages
When you have SEO and PPC teams that don’t chat with each other, this is another issue you can run through it: are you targeting users with the same pages? Now, fair play to PPC here: they have the ability to test different pages and quickly learn which is the best one.
In can happen at the other side too: you have a great SEO converter but keeps sending your PPC customers for another one, even if the keyword triggering the search is the same.
After taking all of your URLs using a crawler (Screaming Frog, Sitebulb, DeepCrawl), you can quickly match the pages using an IF rule in Excel or Google Sheets and you will quickly know if these are matching:
=IF(B6=C6,"Same Landing Page", "Different Landing Page")
Having different pages is not necessarily a bad thing, as there are various reasons to do it so, but you can certainly spot big converters or problems with your SEO rankings if you know a PPC page convert well but your SEO returns a bad or unexpected result.
Ps: this is assuming, of course, that you don’t have specific landing pages for PPC. If you have, wouldn’t make sense to use that for SEO as often the content we need to support good rankings would just be removed in these pages with a stronger sales focus.
7 - Insights to improve your page titles
Just answer in your head: what was the last time you updated the page titles for a long-term client? Sure, you did it once you started working together… That was it? So, someone a few meters from you is testing different headlines all the time. They try a few options and eventually discover the best one to use for a while.
Why can’t SEOs be a little more like PPCers and find the best title as well? Sure, we need the right keywords more than a snazzy title, but sometimes you can combine them. Combining the two PPC headlines will give you 60 characters and in SEO you have at least 65.
Here’s an example:
SEO Title: Vacuum Cleaners – [Brand Name]
PPC Title: Buy Vacuum Cleaners Online Final Reductions - Ending Soon
This specific client had nearly a 20% CTR using this PPC title for a generic and competitive keyword last month. Not too hard to improve the SEO title having more elements without losing the SEO value, right?
Take your GSC keywords, pull your SEO title and Headlines 1 & 2 from PPC and compare those, looking as well at your PPC CTR and total clicks. This is your first step to create titles that work for bots and people!
The easy way to plug the data (how-to guide)
If you watched my talk at Give it a Go, I promised a way to make it easier for you to uncover the 7 points above. My Google Sheets SEO + PPC combined is a work in progress, so keep in mind that you might need to do some adjustments to use properly.
The document basically has a few formulas (Vlookup, If and basic mathematical operations) and 8 tabs with data. A dashboard with overall numbers and one for each of the 7 points above. You will have to populate 4 other dump tabs:
- GSC Dump = Google Search Console export
- Crawler Data Dump = Page Title tab from Screaming Frog
- SEO Ranking Dump = Keyword, Position and URL from a keyword tracker
These three tabs are simple to copy and paste: the first two you don’t have to make any changes, just download the data, copy and paste. The third one has only three columns, so it’s also simple to match.
The 4th tab is the PPC Dump and requires a bit more work. You need to go to Google Ads > Reports > Table and select the fields you need, in the following order: Search term, Clicks, Impressions, Cost, Avg. position, CTR, Avg. CPC, Conversions, URL, Headline 1 and Headline 2. Once you export the file from Google Ads, just copy and paste on the dump sheet.
Keep in mind this is the very first version of this tool, so there’s some manual work to do. The next step I imagine is to start integrating these with the Supermetrics add-on to decrease the manual work to plug the data, use Google Search Console API to uncover a higher number of keywords and show the results in a nicer Data Studio report. Follow me on Twitter to be to first to know the updates!
If You Liked That...
We've also shown how you can integrate search and social for better results. Check out this quick video from Al and Roisin to learn how!


.png)


_2025.png)