


We’re employee-owned, every team member you work with brings the mindset of a business owner.

Alan Coleman, CEO


For this edition of OTM, we have a special report on the revenue growth of e-commerce retail websites in Ireland for the first six months of 2022. We’ll be comparing it to H1 2021.
Beyond that, we’ll look at how things have changed by comparing the data to the pre-pandemic H1 2019.
Aside from the growth report, this post will also discuss how customer behavior has changed and what digital channels contribute the most e-commerce revenue to the retailers within the dataset.
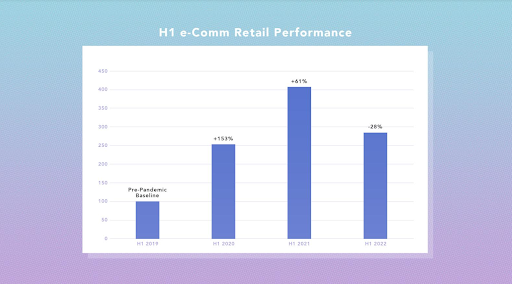
COVID-19 hit Ireland mid-March in 2020 and we were in lockdown within weeks. During this time, website revenue surged by >150% year on year as people adjusted to the new reality.
Covid restrictions only officially ended at the end of February 2022! Now that we’ve settled back into our (new) normal lives, how has online spend fared?
Across the data set, online revenue has actually contracted YoY. We recorded a median contraction of -28% vs H1 2021. 65% of retailers analysed have experienced decreasing revenues vs. the online boom periods of 2021 and 2020.
This slow down is likely to be a direct result of the harsh lockdown restrictions imposed for much of H1 2021 vs. the removal of all restrictions in February 2022. Put simply, this year online shopping wasn’t the only option available to people.

No, in fact the number of retailers turning over >€1million in H1 increased by 45% in 2022 vs. 2019. So, e-commerce is now bigger business.
Another good benchmark is to compare e-commerce growth since 2019 and the data reveals that in spite of a slowdown in 2022, e-commerce revenue is still up by 121% vs. the same period in 2019. That represents 40% average annual growth since 2019, which is an acceleration from the 32% seen from 2017 to 2019 (i.e. pre-pandemic).
So although 2022 represents a slow-down in growth, the last 3 year period has given rise to a net acceleration in e-commerce growth.
It is also important to note that some of the retail demand simply shifted from online to offline as restrictions were lifted. In fact, for the first 5 months of 2022 the CSO recorded a 12%-13% increase in retail sales (excluding motor trades and bars) vs. the same period in 2021.
Anecdotally, we’re also aware of multichannel retailers reporting increases in overall revenues YoY (online + offline) where in-store sales have mitigated any e-commerce contraction.
Comparing H1 2022 with H1 2019, there are two metrics that combined to result in an e-commerce multiplier effect. They are website traffic (up 70% since 2019) and website conversion rate (up 46% since 2019). So, more website traffic converting more efficiently.
The website conversion rate increase over this time of 47% (from 1.46% to 2.14%) suggests a change in consumer behavior that has stuck. That is, Irish people now have an even higher propensity to shop online.

Website conversion rate increase from H1 2019 to H1 2022
This point is further supported in the data where conversion rates for items with typically high average order values (such as jewellery, garden furniture or large appliances) are up by >100% since 2019.
Irish people are now more comfortable shopping online for expensive items that they would previously have wanted to see or try in-store.
During the pandemic e-commerce retailers turned to paid media to help immediately capitalise on growing demand.
Paid search and paid social traffic increased by 73% and 69% respectively compared to 2019.
Within our dataset we also identified a direct correlation between paid media investment and revenue growth since 2019.
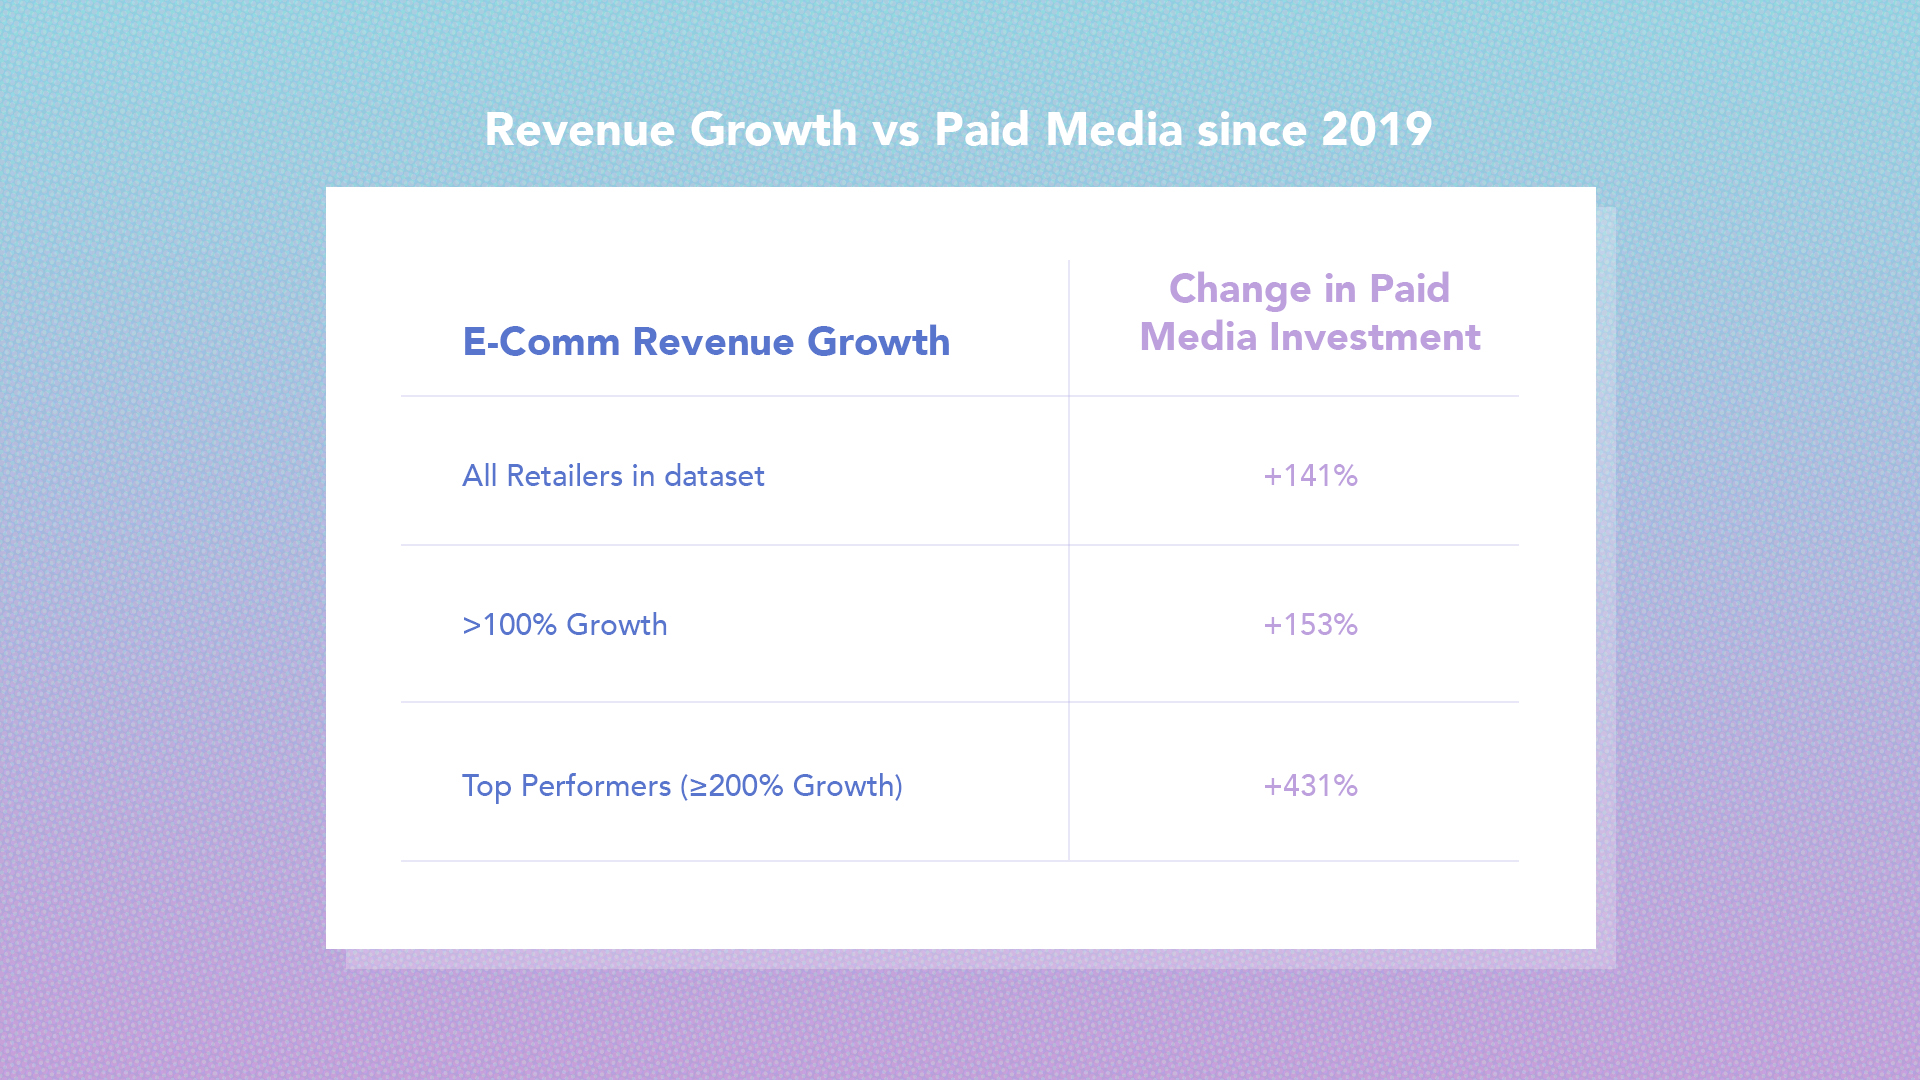
Table 1: Revenue growth vs paid media investment since 2019
Further context on this increased investment can be found in our previous analysis around increasing CPC’s across Google and Meta.
However, paid media wasn’t the channel with the largest increase. As retailers looked to de-risk their over-reliance on the big tech platforms of Google and Facebook, many of them turned to email marketing which recorded 89% growth compared to 2019.
This shows that savvy e-commerce retailers have been paying attention to the changes that are happening in the digital space related to third-party cookies and have turned to email to nurture their own first-party data.

The outlier is that organic website traffic (i.e. non-paid Google traffic) has only grown by 19% vs. 2019. This is likely to be a function of the increased investment and attention on paid media combined with an under-investment in SEO which is often seen as a longer-term strategy. As retailers now take a longer-term view post-pandemic, we’ll likely see more longer-term investments in activities such as SEO and CRM initiatives.
The growth achieved by retailers since 2019 hasn’t only come from domestic customers either. Our data set records a median increase of 119% in e-commerce sales coming from outside Ireland. That means that retailers have grown their international customer base in line with their overall revenue growth. However, the growth opportunity here remains significant, since only 6% of revenue generated is coming from outside the republic of Ireland.
About the data
We estimate that our data represents 5% of the Irish online economy and includes a mix of online and multi-channel retailers. We’ve used median values to normalize the large variations that can exist across the data set, particularly in terms of YoY percentage changes. Some of our retailers experienced >1,000% increases YoY which skews the data if we apply averages. Therefore, median values are a more appropriate benchmark.
CSO data is widely available from https://data.cso.ie/.
Brendan Almack, MD
brendan@wolfgangdigital.com


Partner with a 6x Best Global Agency Winner that's as invested in your growth as you are.


