


We’re employee-owned, every team member you work with brings the mindset of a business owner.

Alan Coleman, CEO


Wolfgang Digital is an equal opportunity employer committed to fostering an inclusive workplace


Wolfgang Digital is an equal opportunity employer committed to fostering an inclusive workplace

In this post I will answer the above Google Analytics questions using data from The Wolfgang E-Commerce Benchmarks 2016 Report.
So once you’ve got the prospect to your website, how can you expect them to behave? We’ve broken on-site metrics down into 2 categories. “Engagement metrics” and cold hard “conversion metrics” which should prove vital to enabling you establish measurable paths to purchase funnels on your ecommence website.
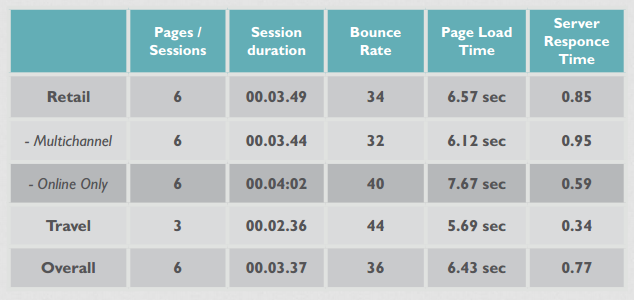
Let’s start with average engagement metrics.
Average Bounce Rate: 36%.
Average Pages Per Visit: 6
Average Session Duration: 3 minutes and 37 seconds.
Understanding the relationship between each form of engagement metrics and how they correlate with each other to bring more efficiency to your own conversion funnel is vital if you're going to succeed in eCommerce.
You can read the full E-commerce Benchmarks 2016 study here or check out the easy to digest infographic here.

Moz / Inc / The Economist / RTE / The Irish Times / Newstalk Radio


Partner with a 6x Best Global Agency Winner that's as invested in your growth as you are.


